Data Visualization
Mixed
데이터 시각화 라이브러리
Python의 시각화 라이브러리는 다양하게 개발되어지고 있으며, 각기 특성이 달라 하나로만 쓰기 어려운 상황임
R의 ggplot2라는 매우 강력한 시각화 도구와 비교하면 이에 상응할 만한 Python 시각화 도구는 찾기 어려움
대표적 도구들
Matplotlib
가장 오래된 Python과 잘 통합된 널리 사용되는 라이브러리
거의 가능한 모든 플랏을 그릴 수 있음
한편, 디테일한 부분을 모두 specify해야 함으로써 많은 코딩이 요구되며, interactive 또는 web graphs에 취약함
pandas
Matplotlib로 구현된 DataFrame의 method로 간략하게 시각화가 가능하며, 빠르게 데이터를 들여다볼 수 있음
Seaborn & the seaborn.objects interface
Matplotlib 위에 개발된 간결한 문법의 high-level 언어
Decalative: 변수들이 어떤 시각화 속성과 위치를 지니는지만 specify
“Grammer of graphics”라는 시각화 문법에 충실하고자 the seaborn.objects로 새롭게 변화 중
Javascript-based 시각화
Altair
“Grammer of graphics”를 충실히 따라 설계됨
각 plot이 이미지가 아닌 data + specification으로 이루어짐: 이미지가 저장되지 않고, 브라우저에서 이미지로 complie되어 생성됨
Web-based interactive 시각화인 D3에 그 모체를 두며, Vega/Vega-Lite로부터 파생됨
javascript-based로 interactive 시각화에 용이하나 Python과 연계가 부족한 부분이 있고, 개발이 더딘 듯
Bokeh
Plotly
다양한 언어(R, Python, Julia)을 지원하며, 기업 수준의 상용화 제품들도 있으며, 지원군 많음
Jake VanderPlas의 2017년 발표 자료 중: The Python Visualization Landscape
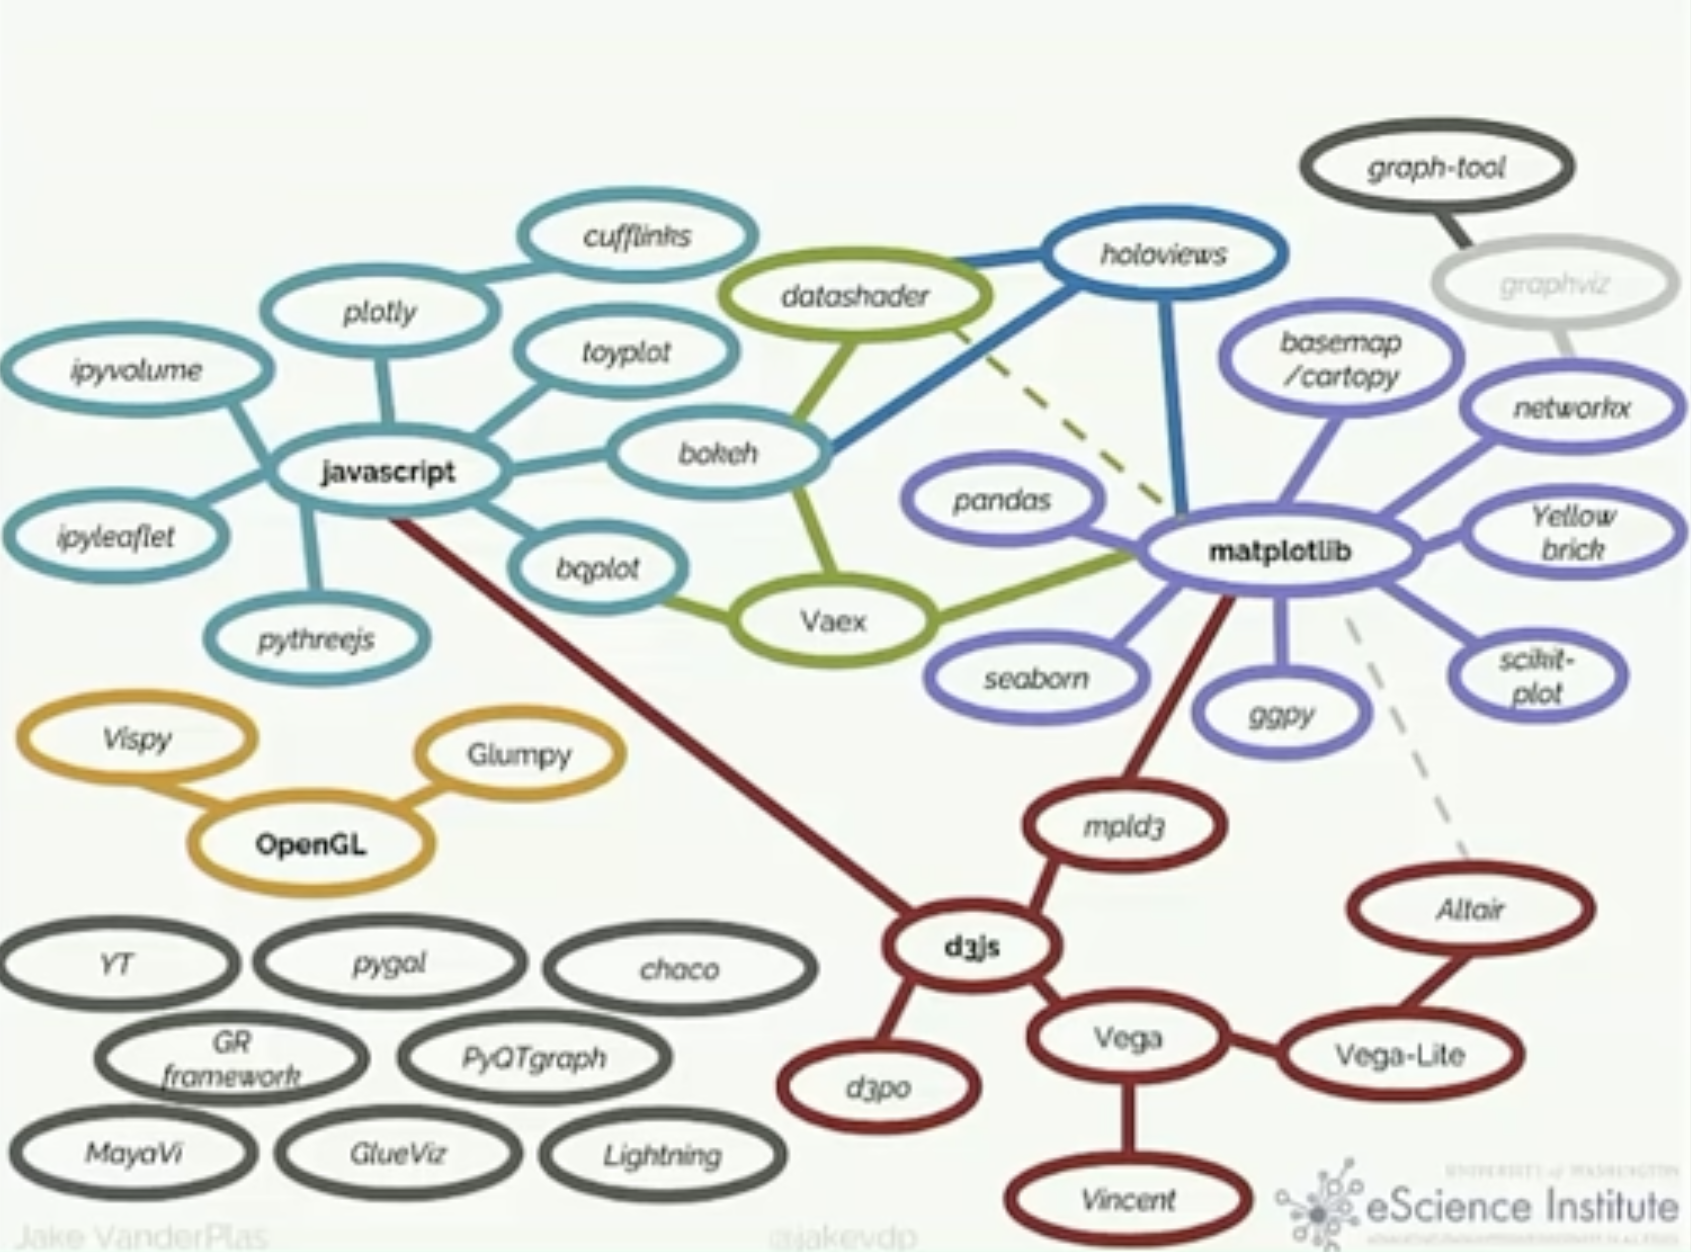
Source: Jake VanderPlas - The Python Visualization Landscape PyCon 2017
시각화 이론
The Grammer of Graphics
A coherent system for describing and building graphs
Source: Fundamentals of Data Visualization by Claus O. Wilke
Aesthetics and types of data
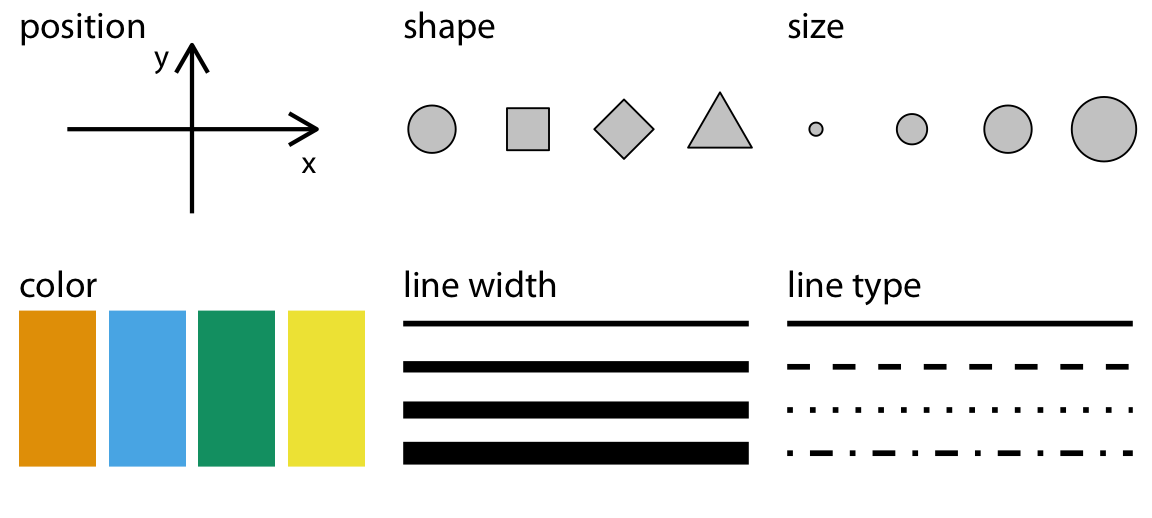
데이터의 값을 특정 aesthetics에 mapping

데이터의 타입은 다음과 같이 나누어짐
- continuous / discrete
- quatitative / qualitative
- categorical unordered (nominal) / categorical ordered (ordinal)
- 성별, 지역 / 등급, 랭킹
- ordinal: 등간격을 가정
- 퀄리티 good, fair, poor는 등간격이라고 봐야하는가?
- 랭킹은?
- 선호도 1, 2, …, 8; continuous?
- 임금 구간?
데이터 타입에 따라 좀 더 적절한 aesthetic mapping이 있으며,
같은 정보를 품고 있는 시각화라도 더 적절한 representation이 존재
Bertin’s Semiology of Graphics (1967)
Levels of organization
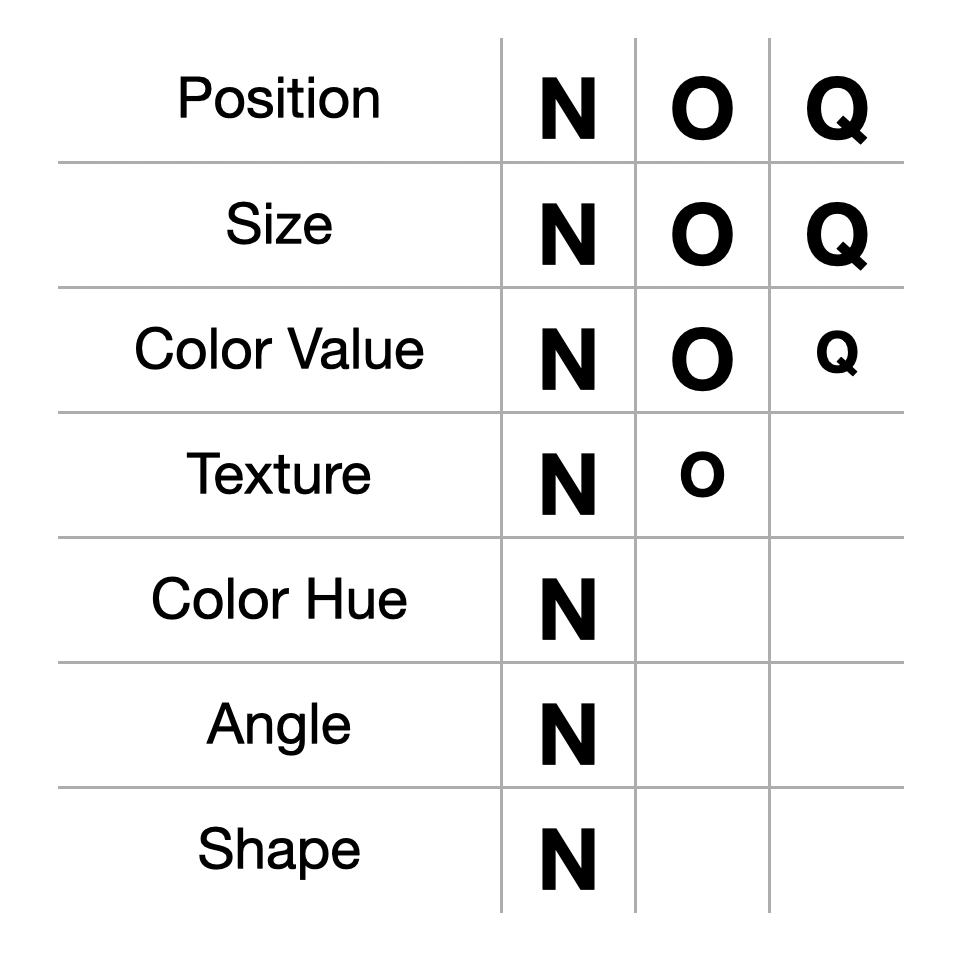
Source: Jake VanderPlas’ presentation at PyCon 2018
Case 1
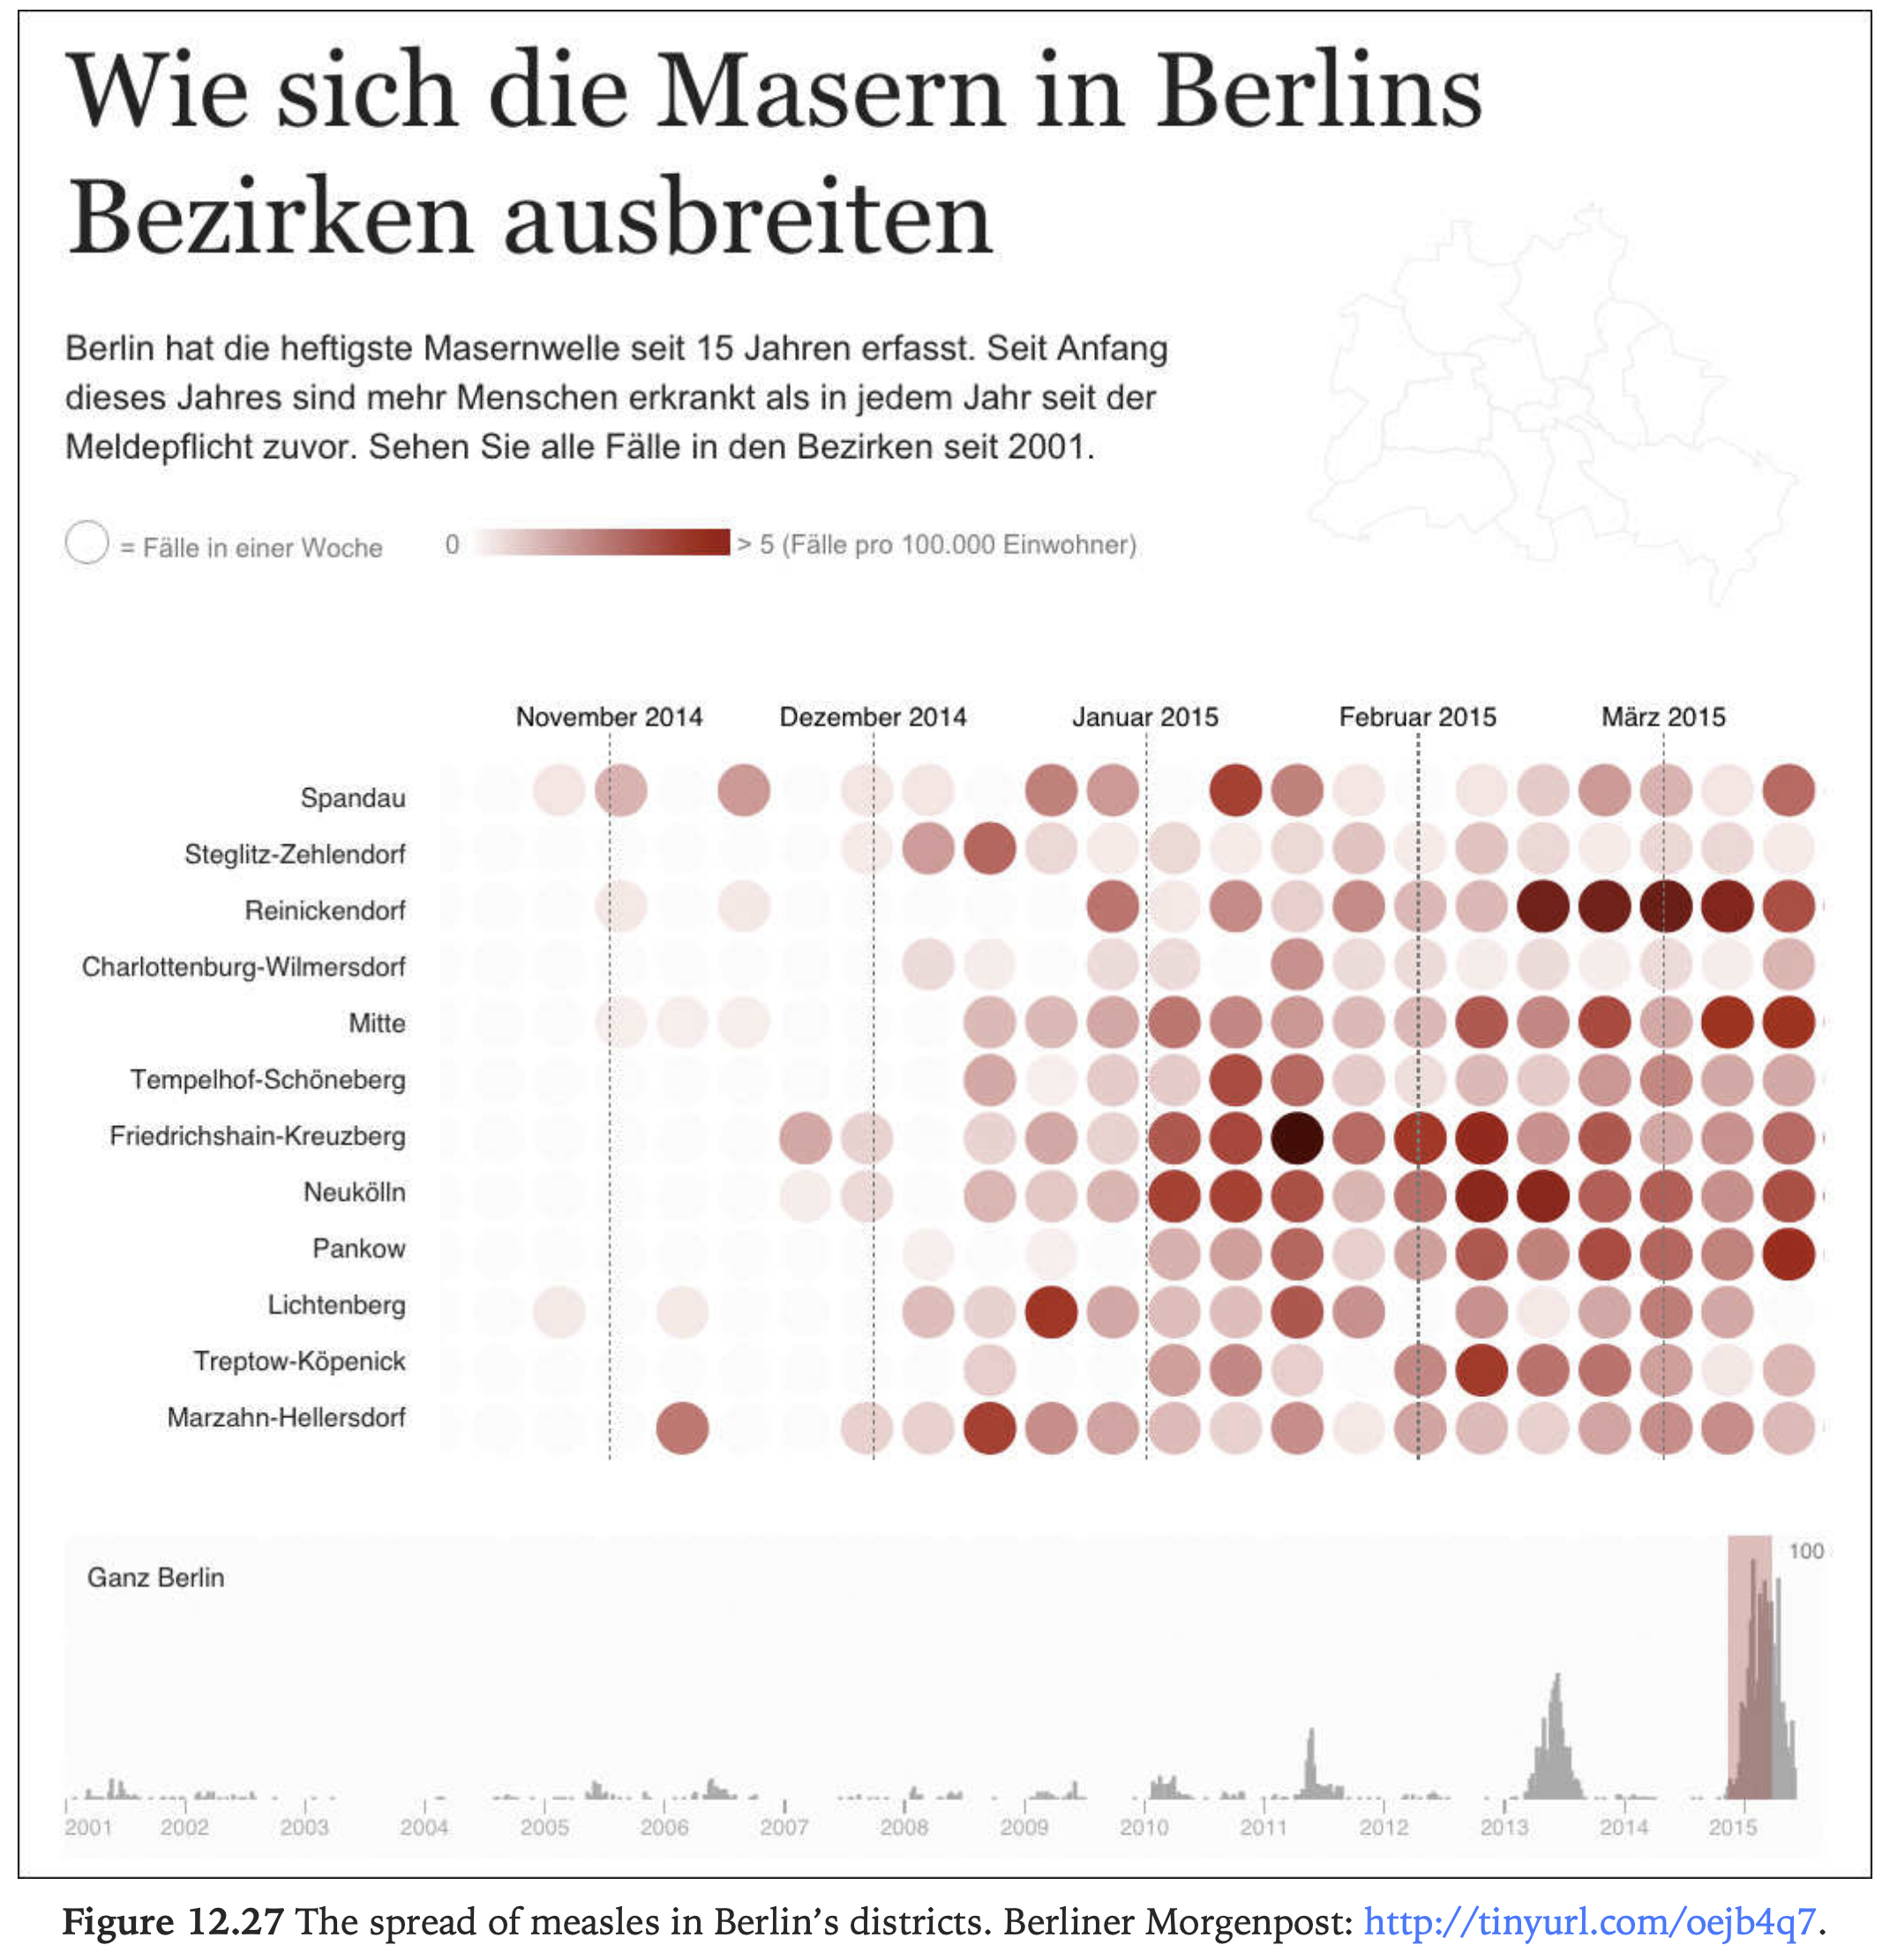
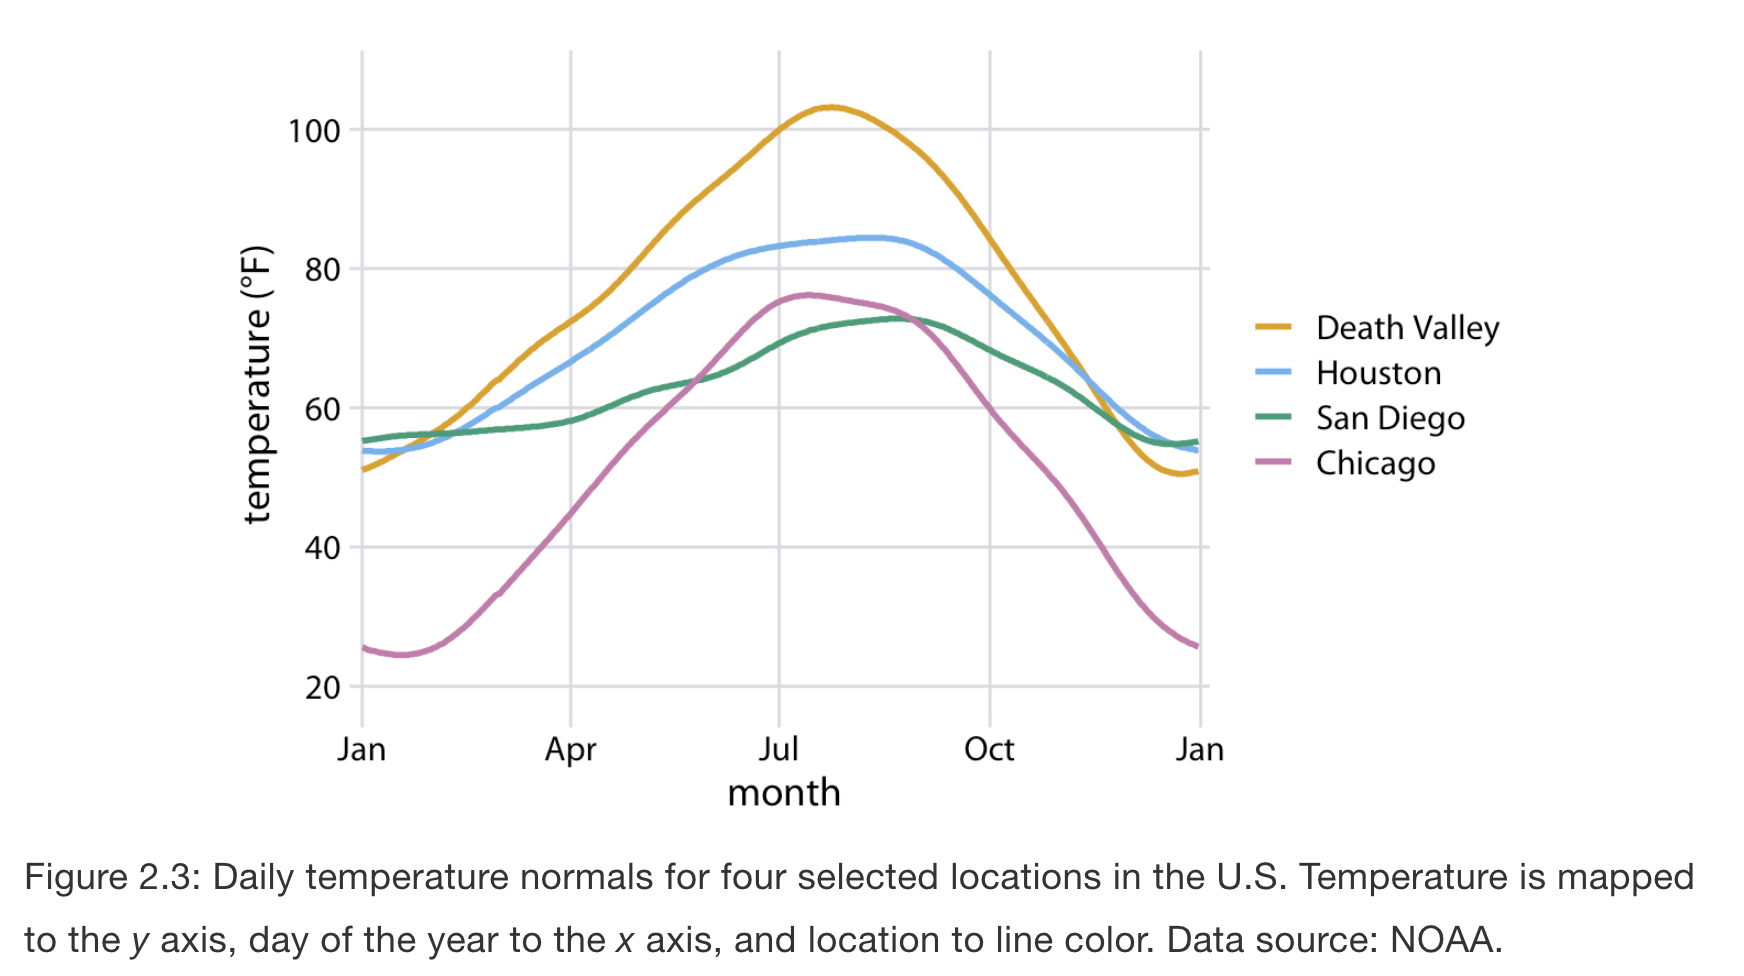
예를 들어, 다음과 같이 1) 지역별로 2) 날짜에 따른 3) 온도의 변화를 나타낸다면,
즉, x축의 위치에 날짜 정보를, y축의 위치에 온도 정보를, 색깔에 지역 정보를 할당했음.
한편, 아래는 x축의 위치에 압축된 날짜 정보를, y축의 위치에 지역 정보를, 색깔에 압축된 온도 정보를 할당했음.
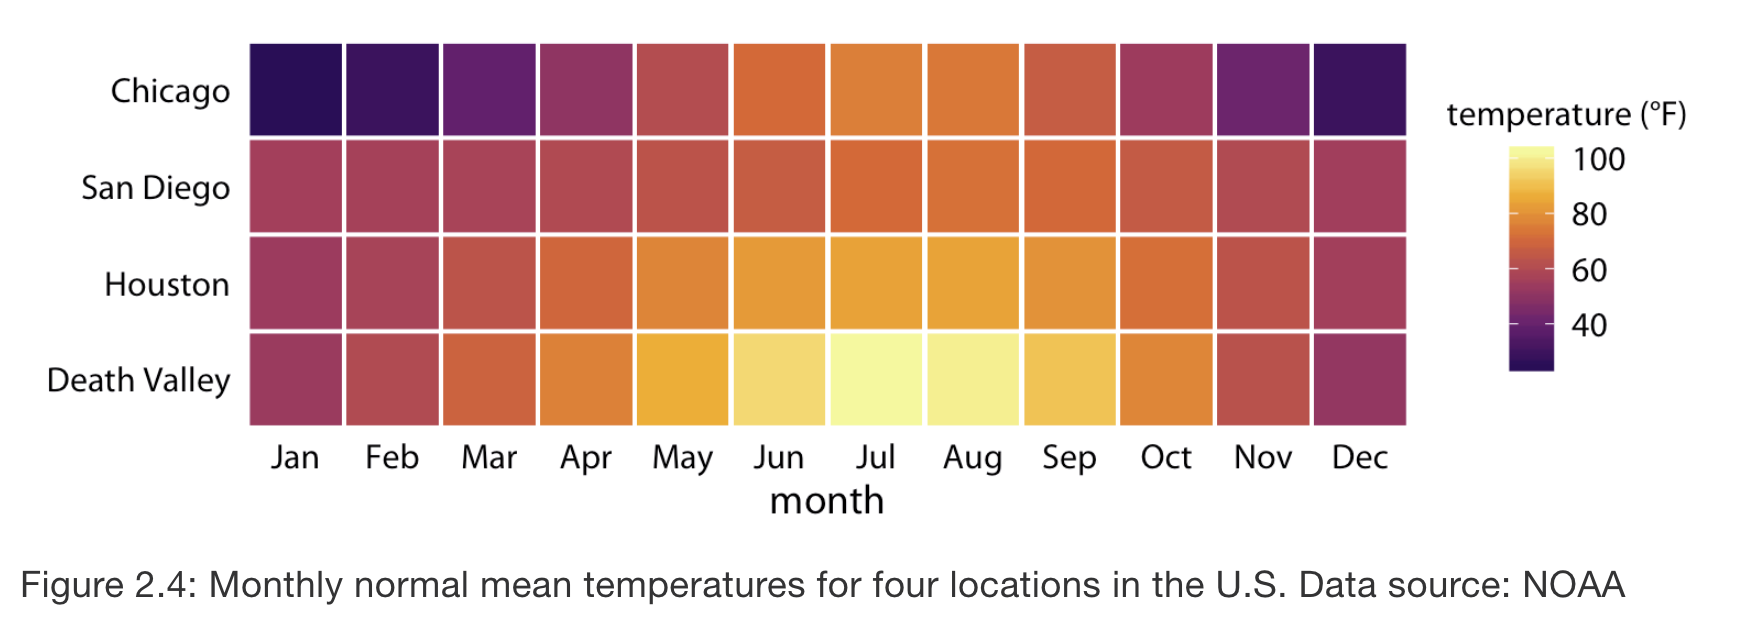
Case 2
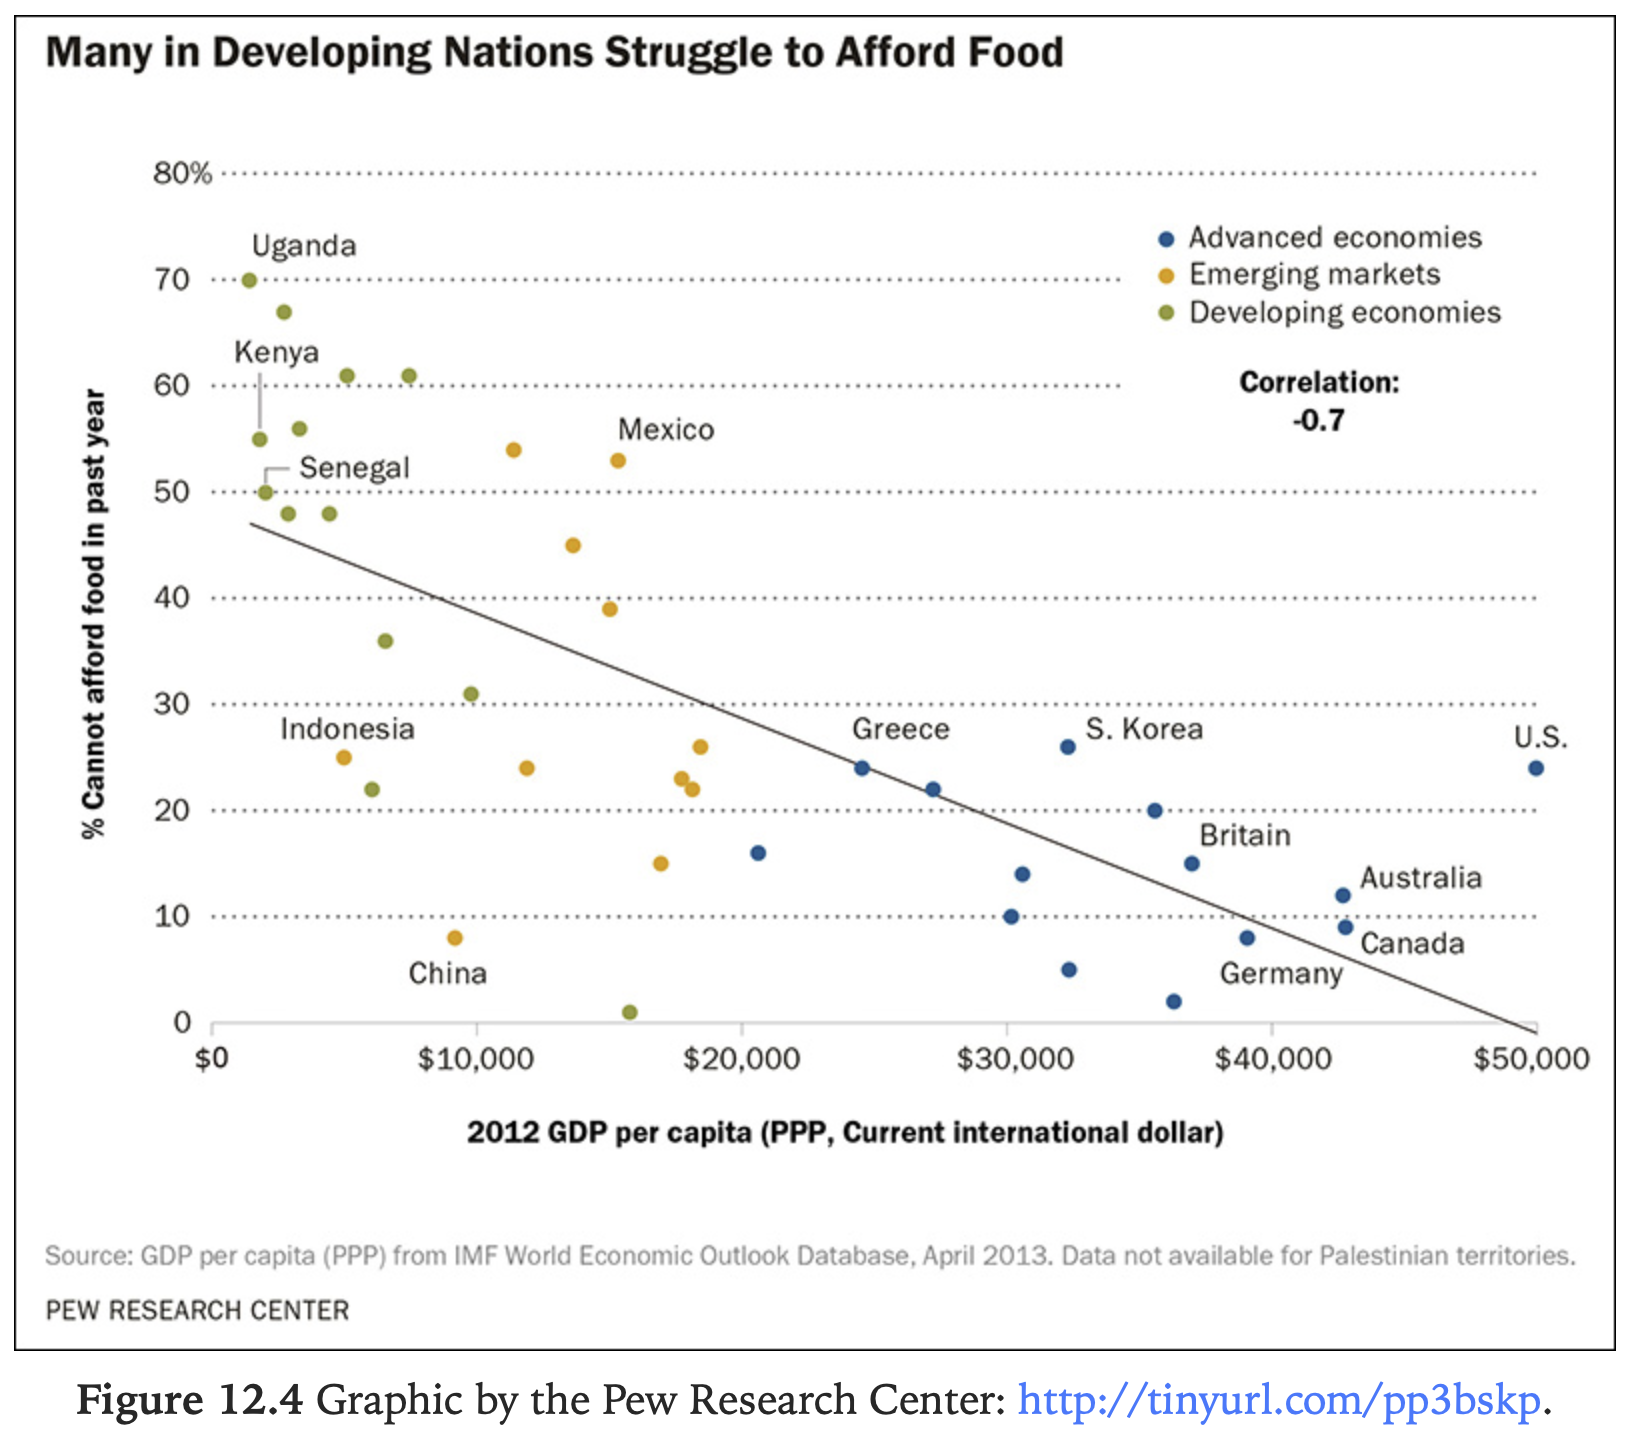
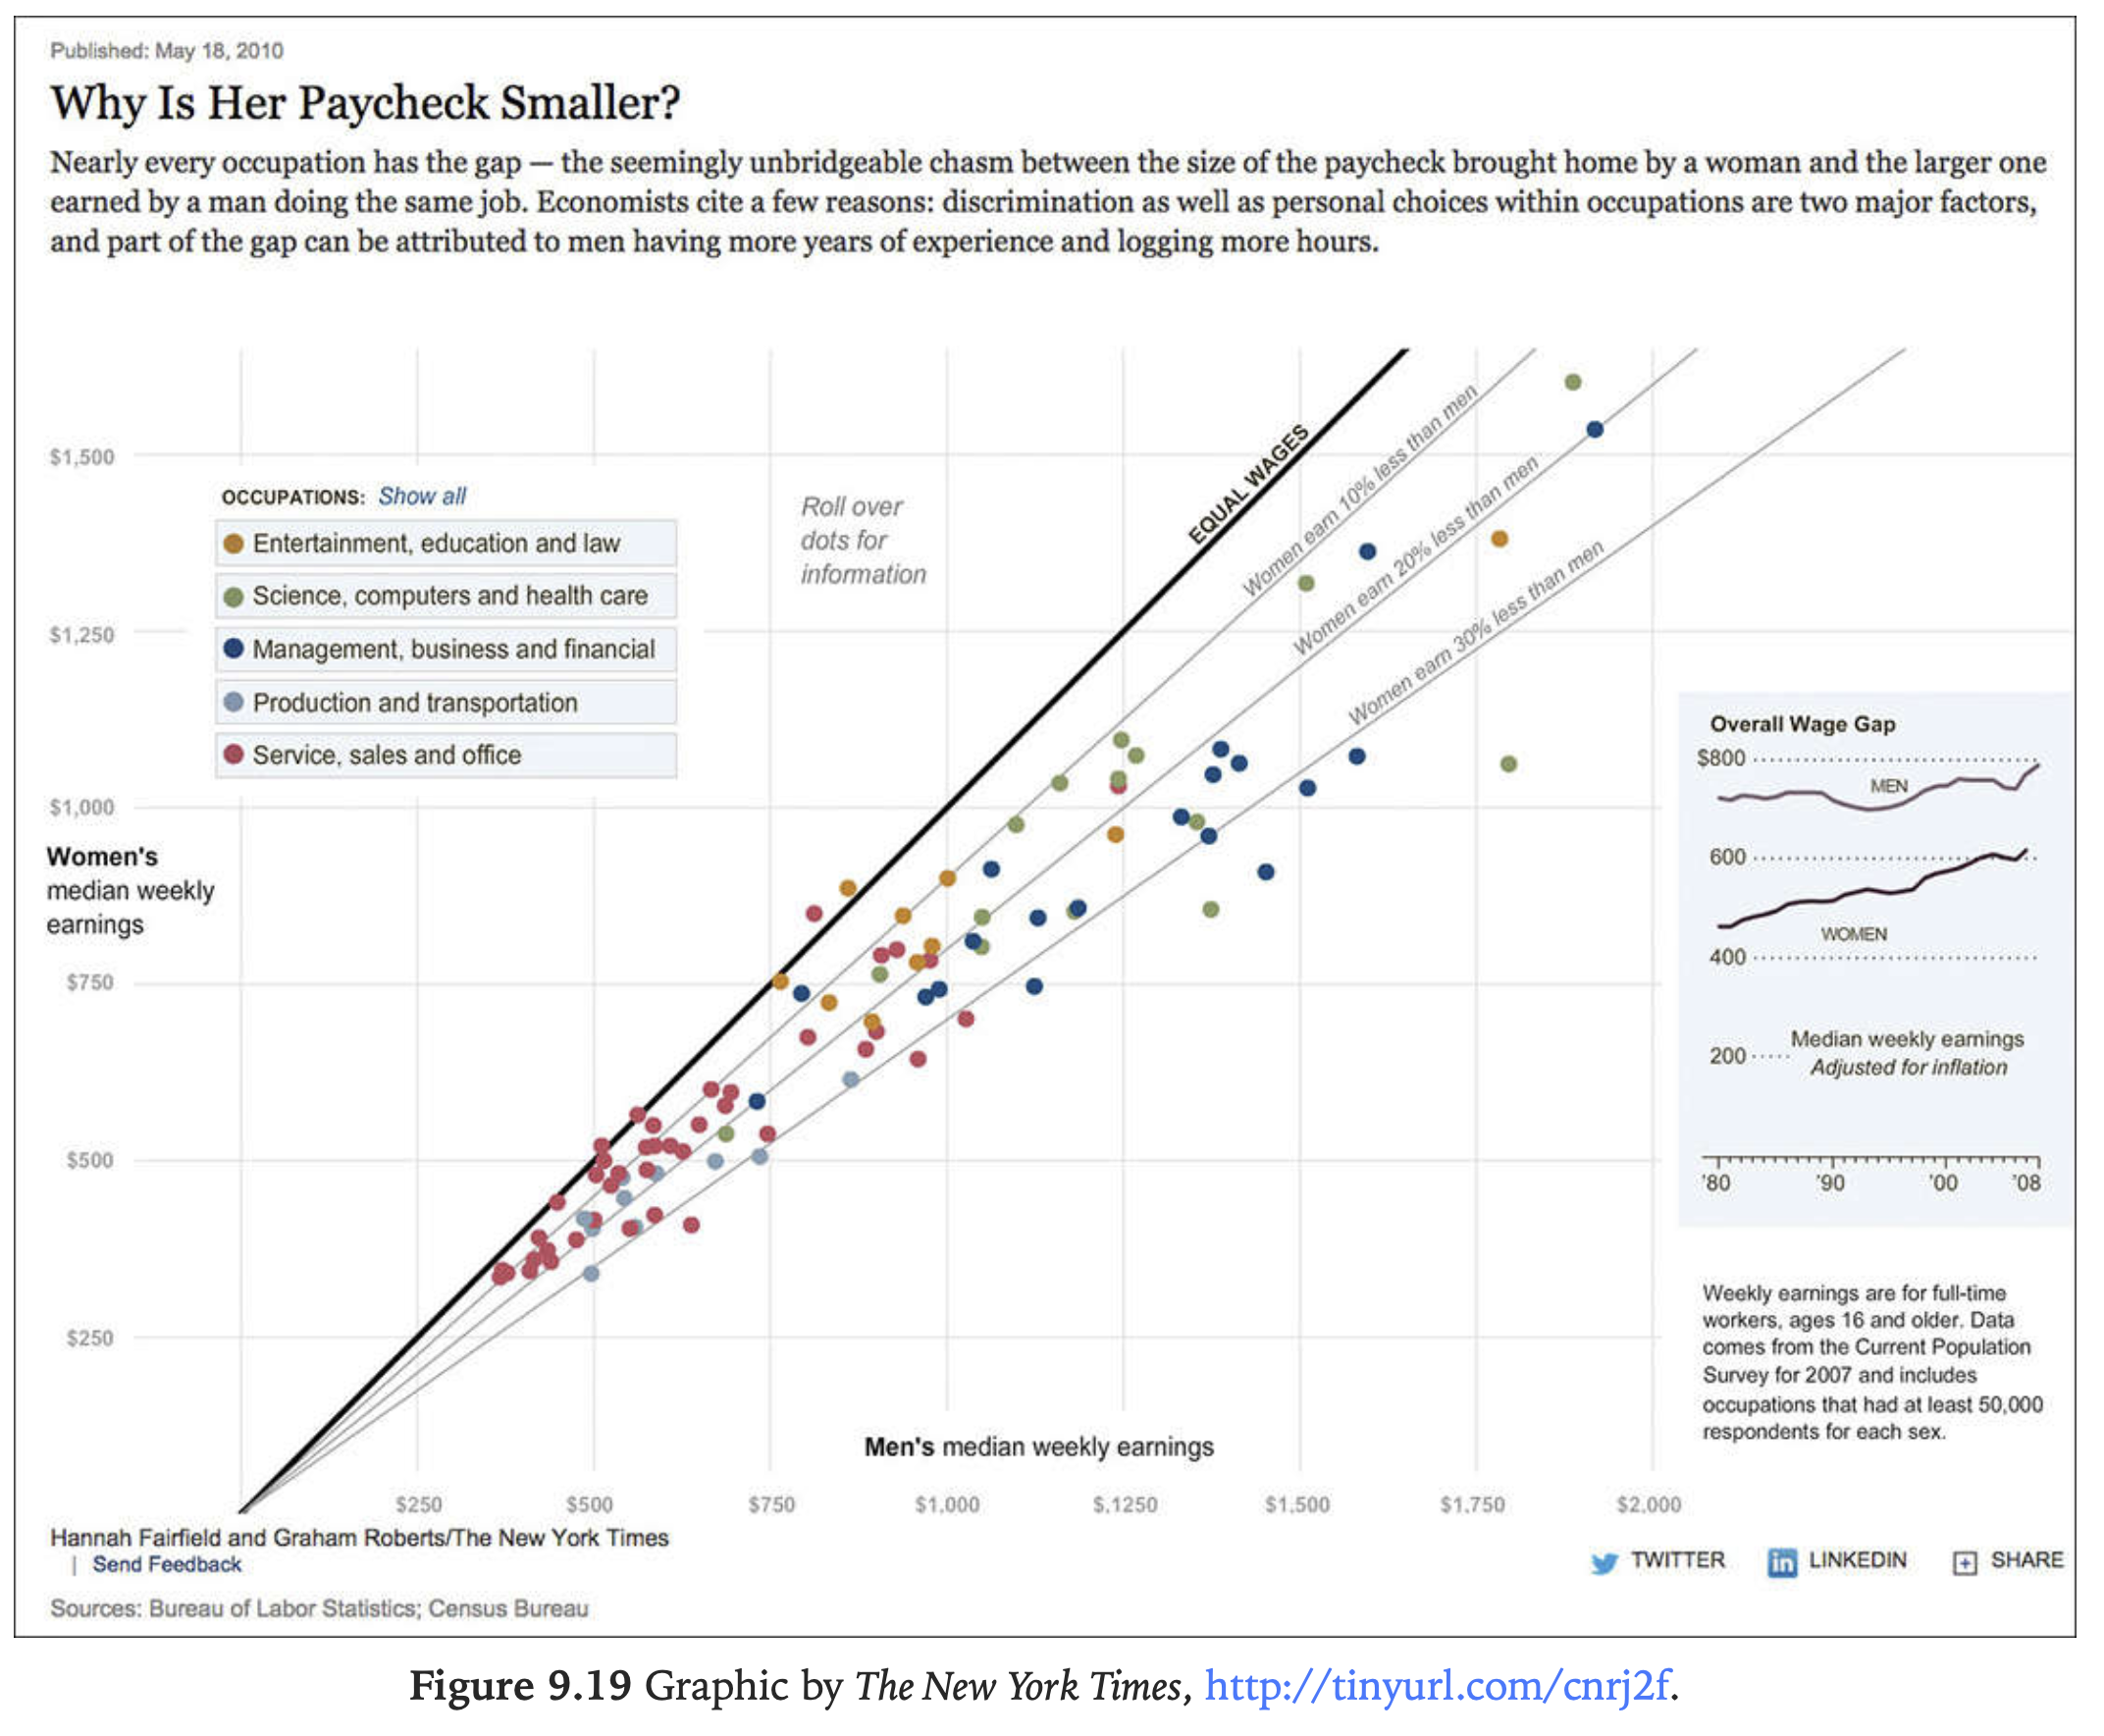
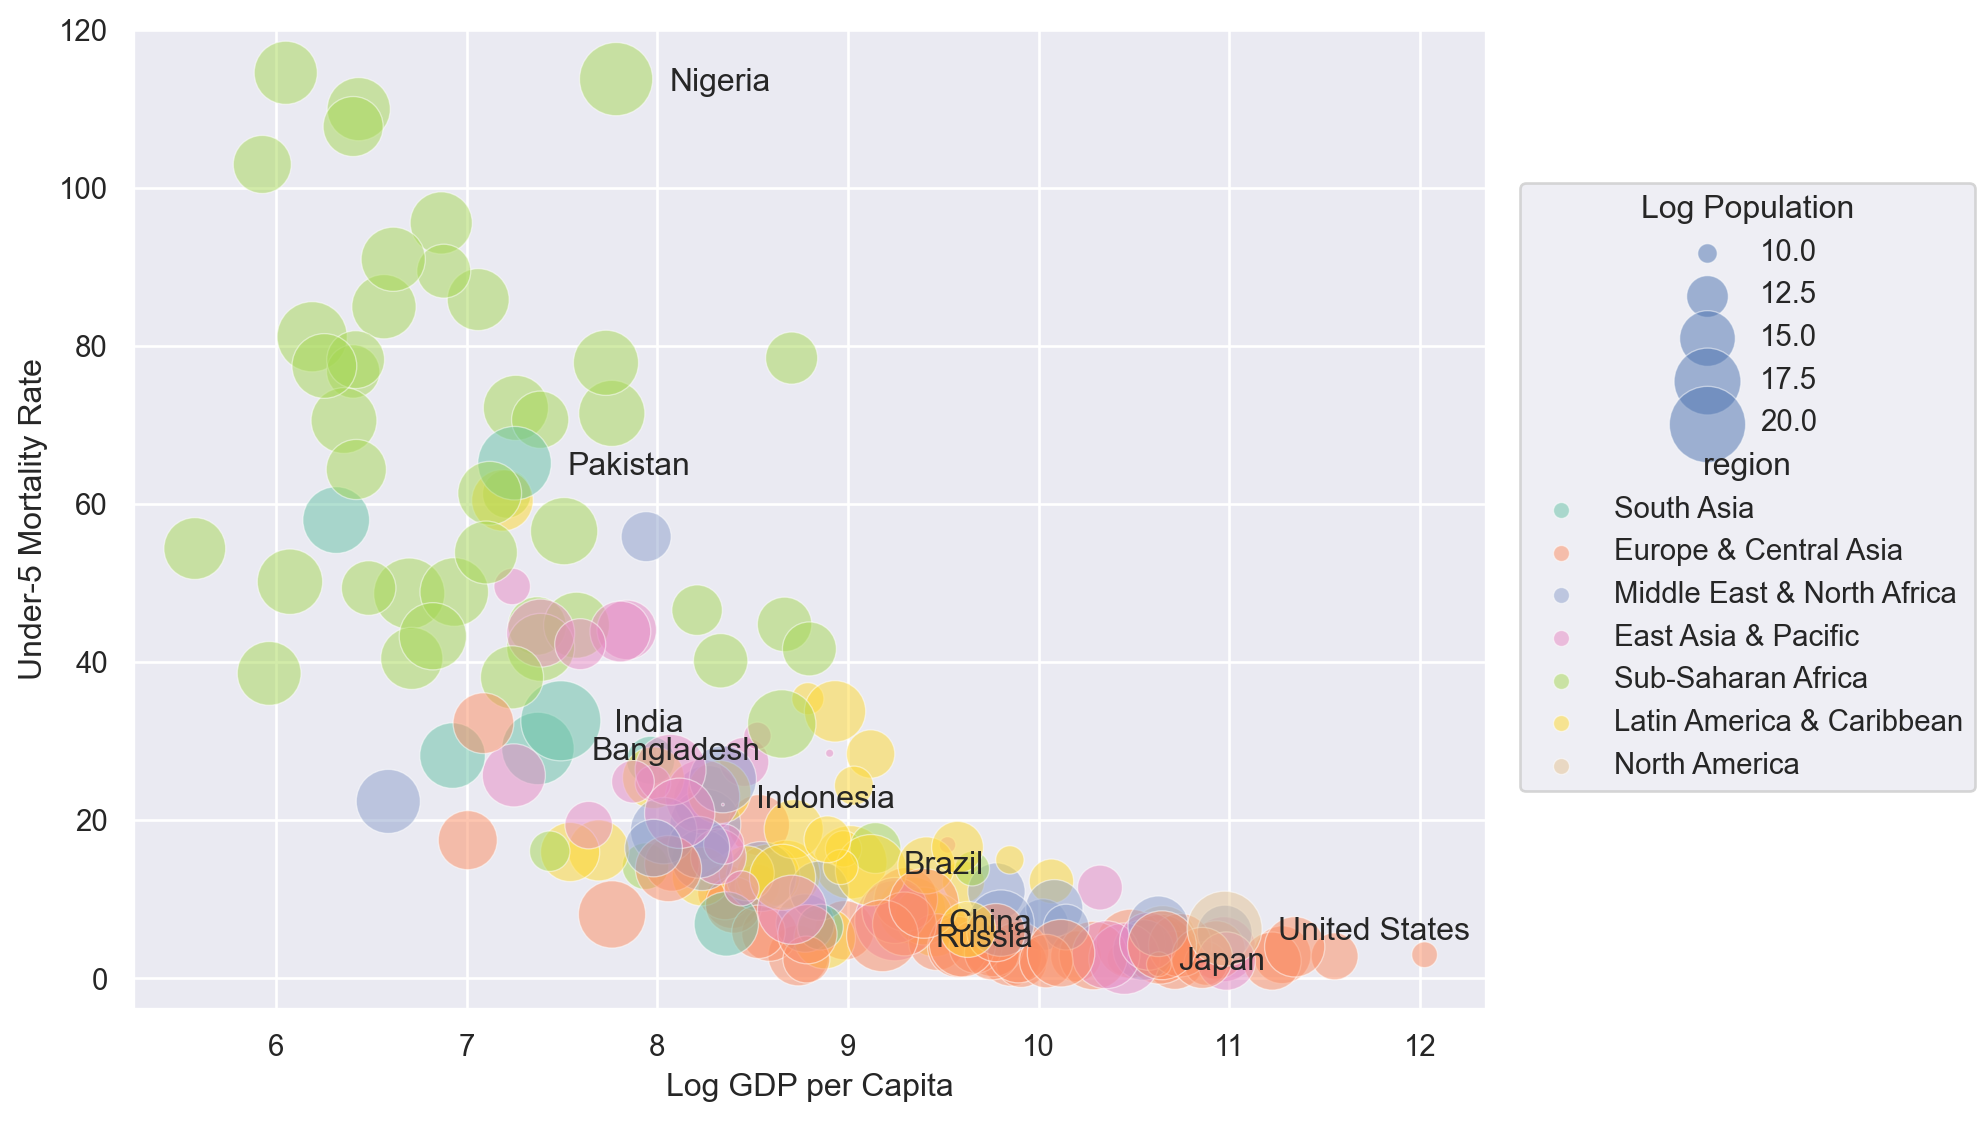
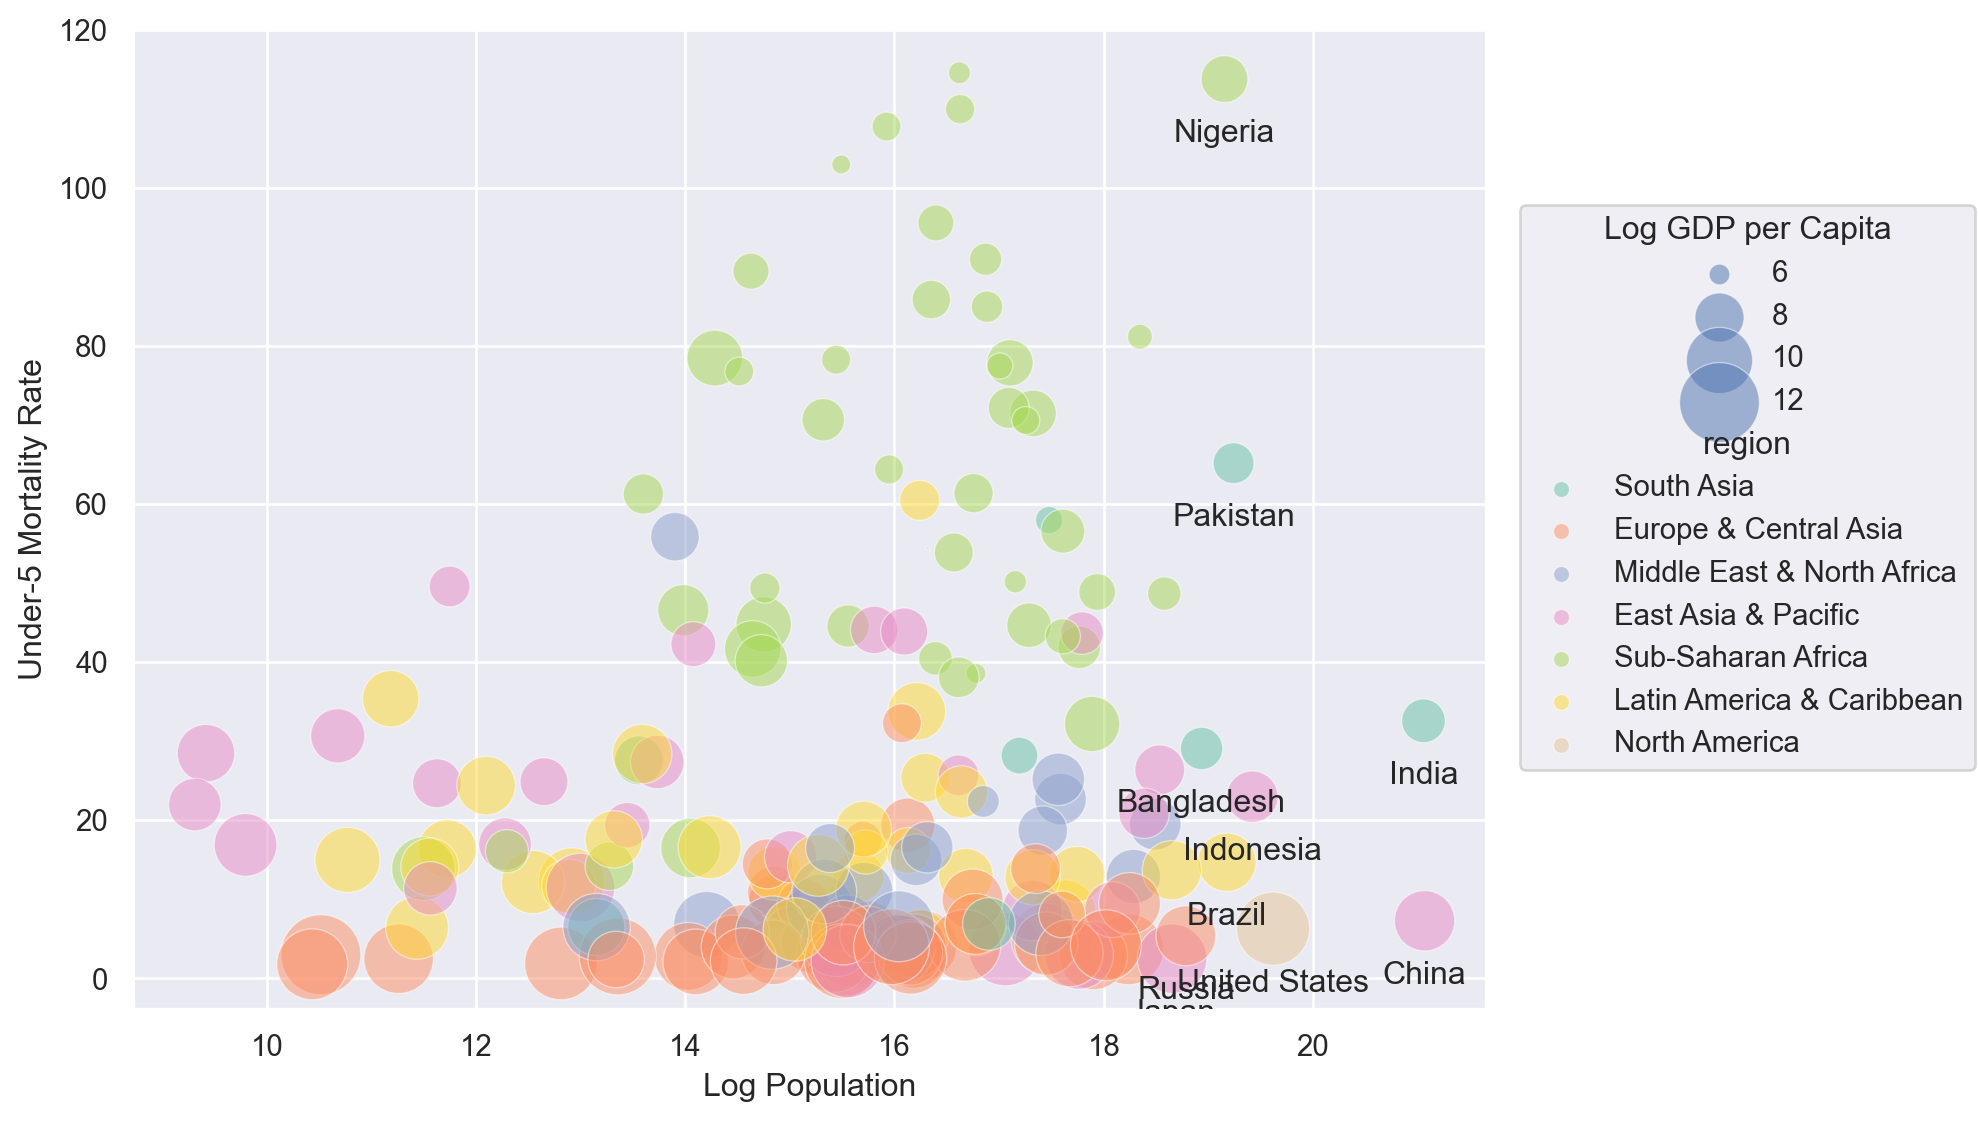
다음은 GDP, mortality, population, region의 네 정보를 다른 방식으로 mapping한 결과임.
시각화의 활용
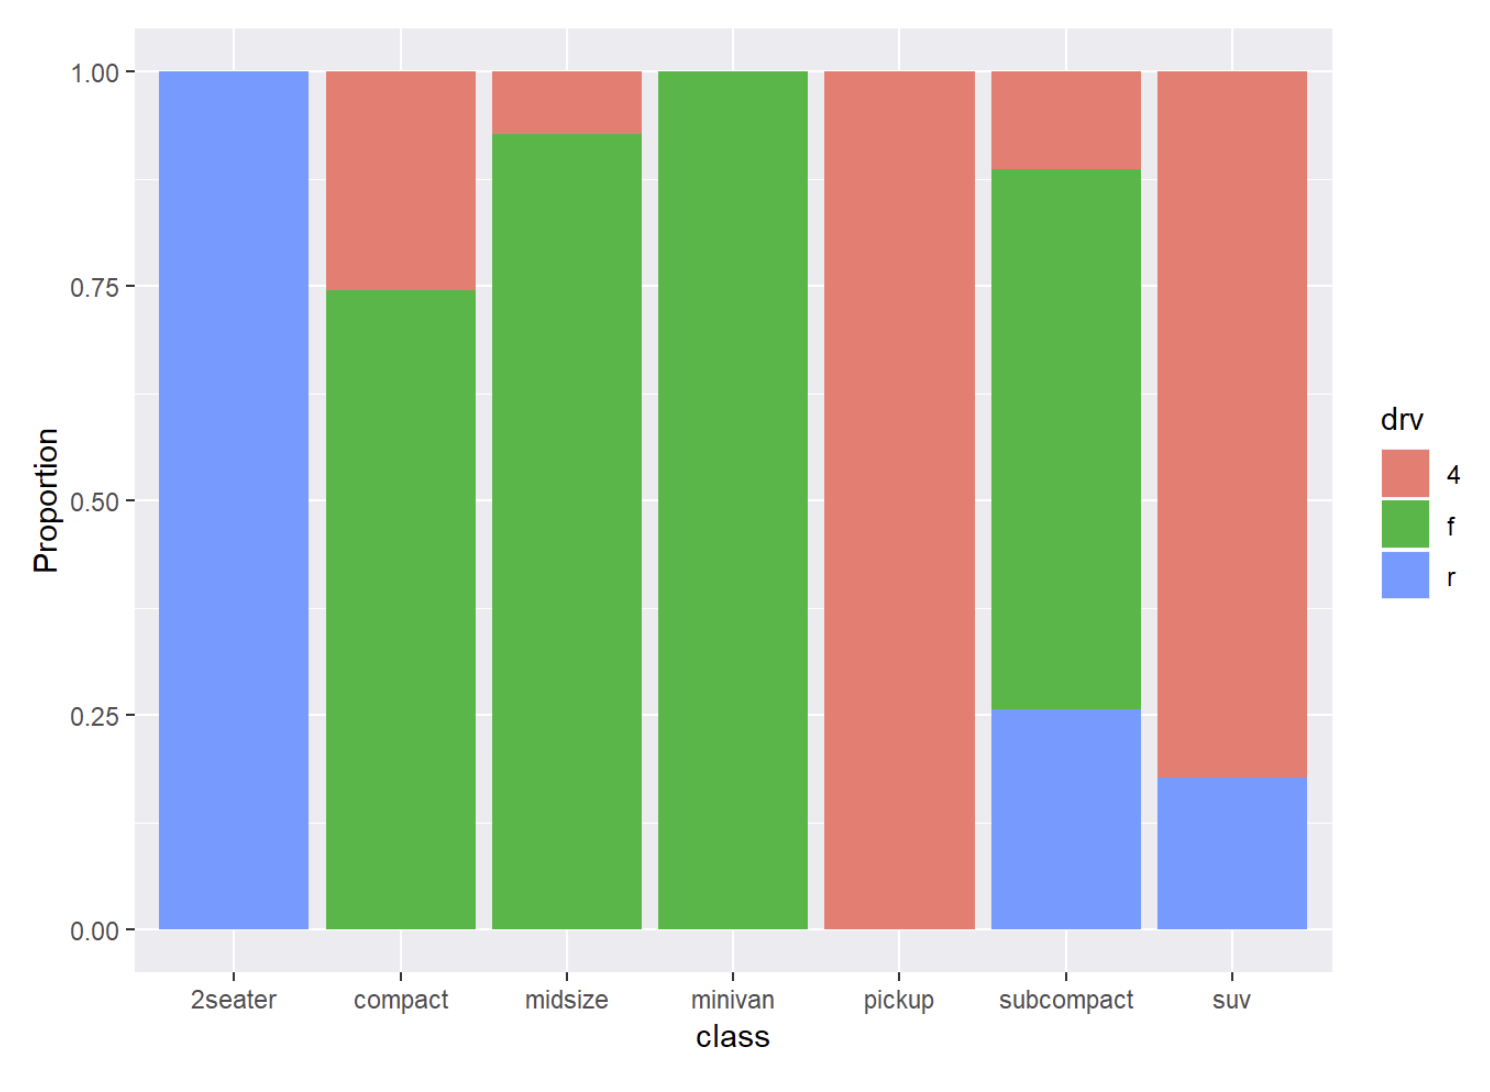
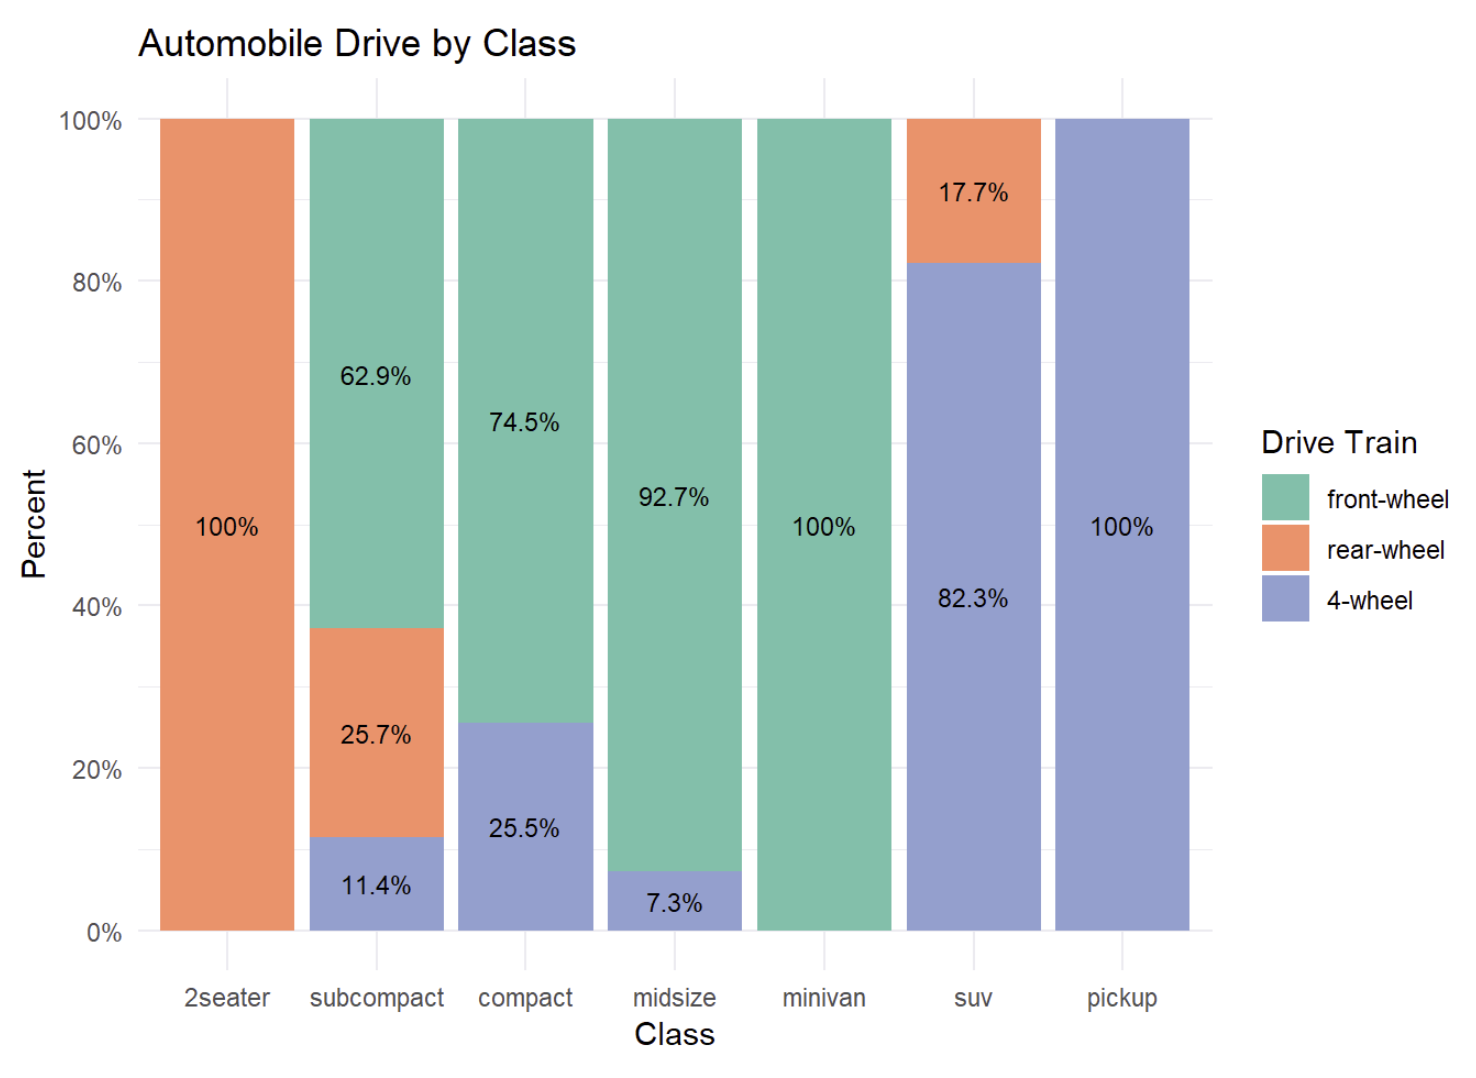
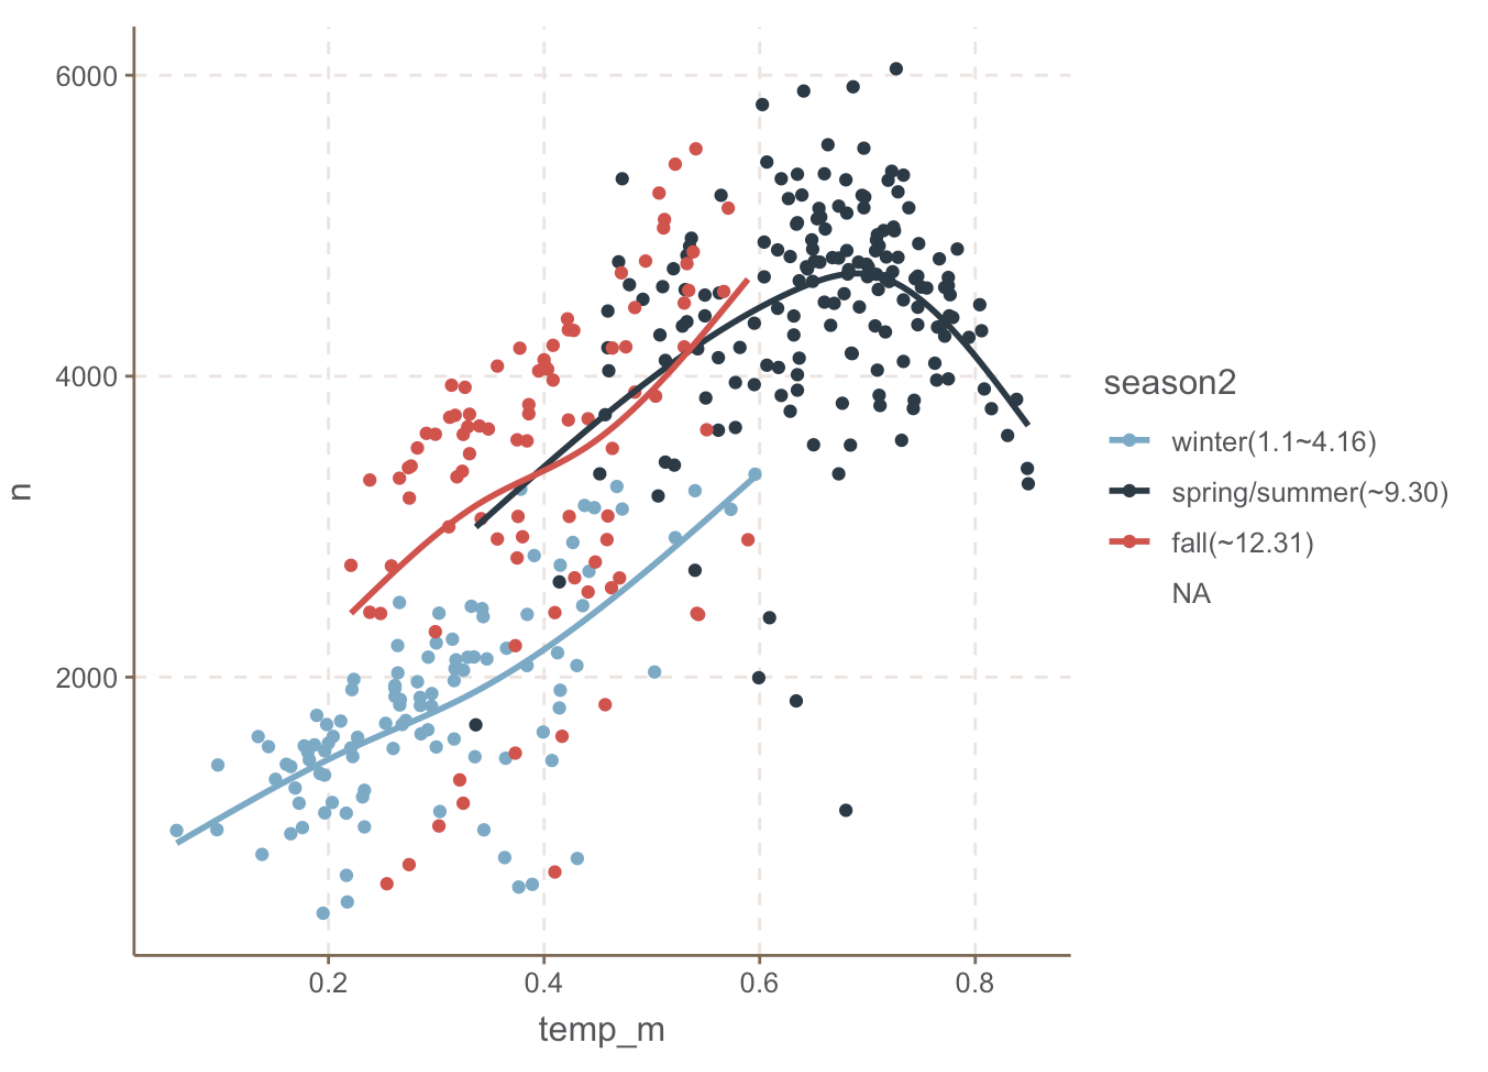
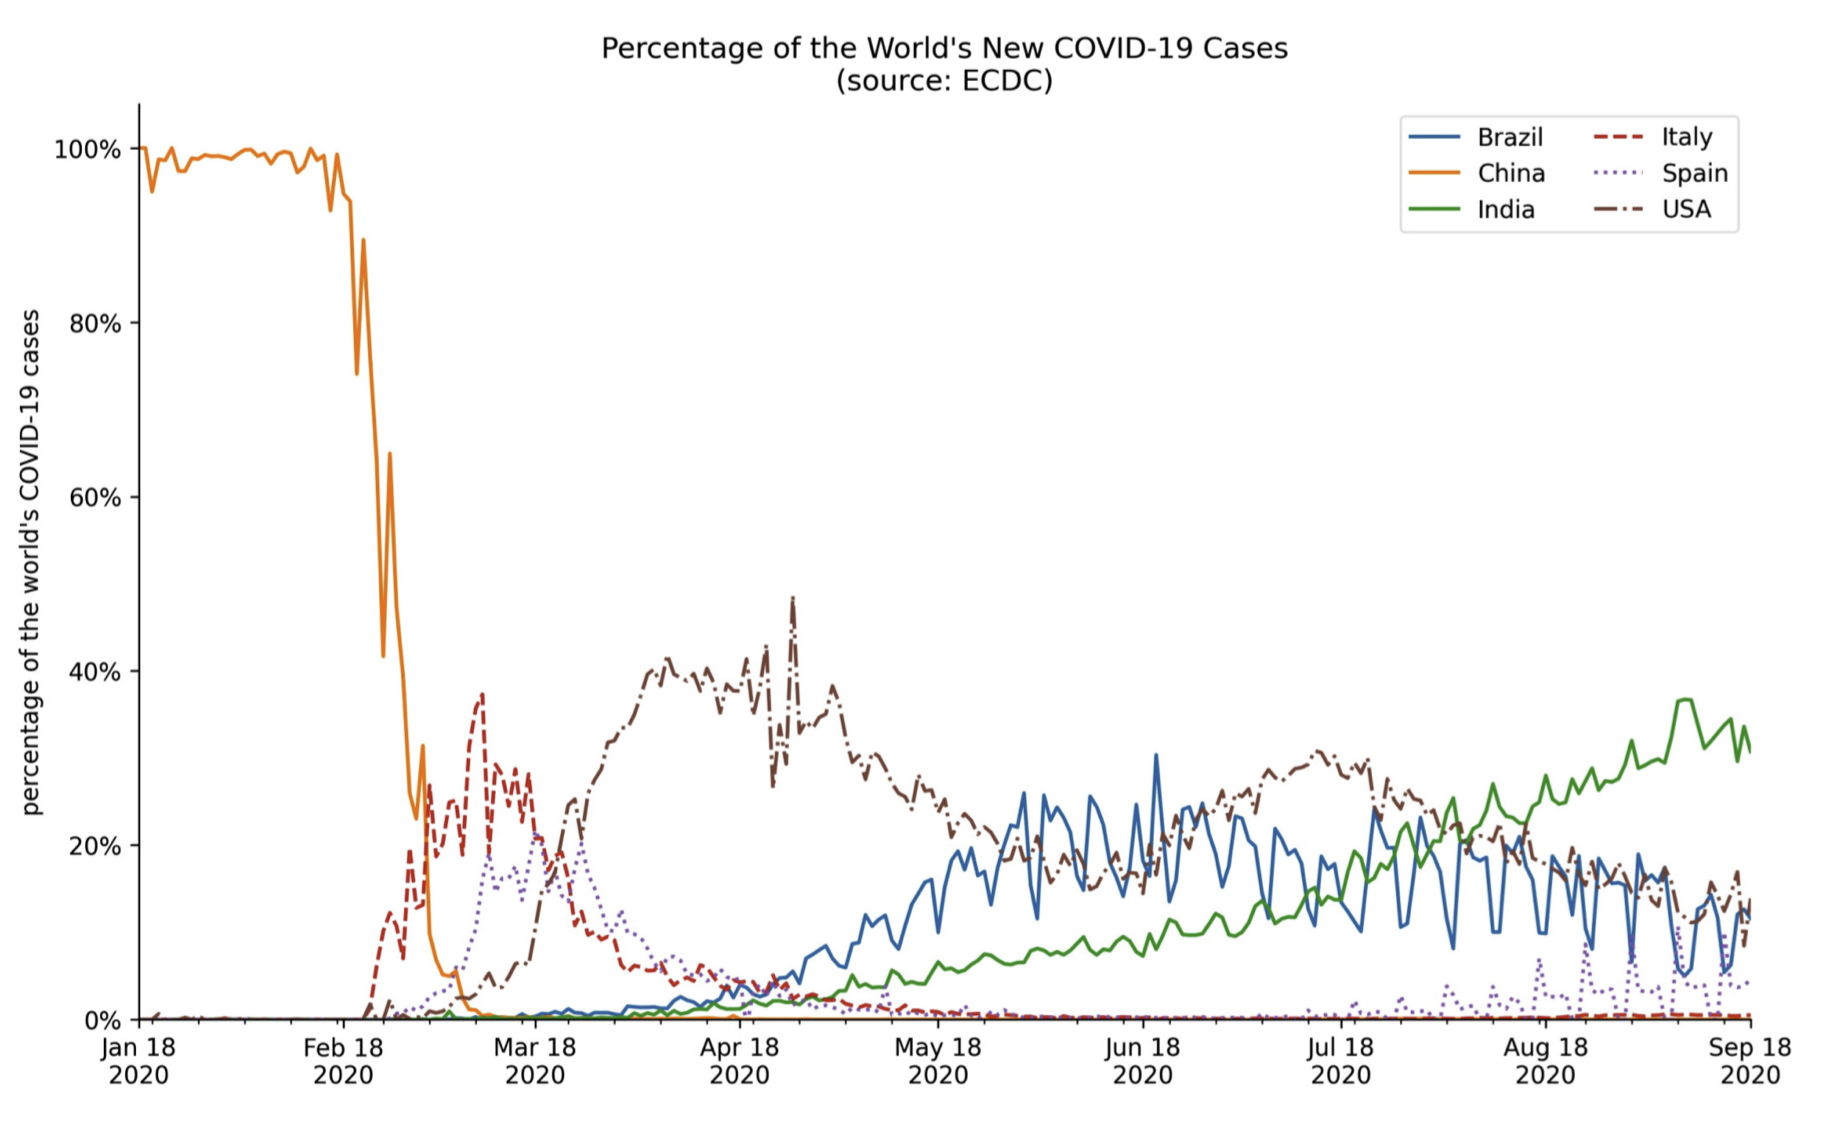
탐색적 (Exploratory) vs. 정보전달 (Communicative)
Interative Plots
Altair
Plotly
정보 전달
The Truthful Art, by Albert Cairo.
