import plotly.express as px

px.scatter(mpg, x="displ", y="hwy", color="drv", trendline="lowess")Alternative plots
R for Data Science by Wickham & Grolemund
Fitted lines
alternatives: plotly, seaborn
Plotly
다음과 같이 smoothing parameter를 지정할 수 있음
자세한 옵션은 여기 참조: plotly linear fits
(
    px.scatter(mpg, x="displ", y="hwy", color="drv",
               trendline="lowess", trendline_options=dict(frac=0.3)) # smoothing parameter
    .update_layout(width=600, height=500)
)
(
px.scatter(penguins, x="bill_length_mm", y="bill_depth_mm", color="species",
trendline="lowess", trendline_options=dict(frac=0.5),
facet_col="island", # faceting
opacity=0.5) # alpha
.update_layout(width=900, height=400)
)Seaborn: lmplot()
sns.lmplot(mpg, x="displ", y="hwy", hue="drv", # color대신 hue
           lowess=True,
           scatter_kws={"alpha":.5, "s":20}, # s: point size
           height=3, aspect=5/3)
plt.show() # 생략해도 무방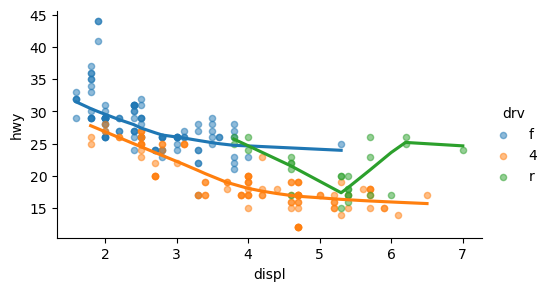
penguins = sns.load_dataset("penguins")

sns.lmplot(penguins, x="bill_length_mm", y="bill_depth_mm", hue="species",
           lowess=True,
           col="sex", # faceting: col, row
           height=3, scatter_kws={"alpha":.5, "s":5})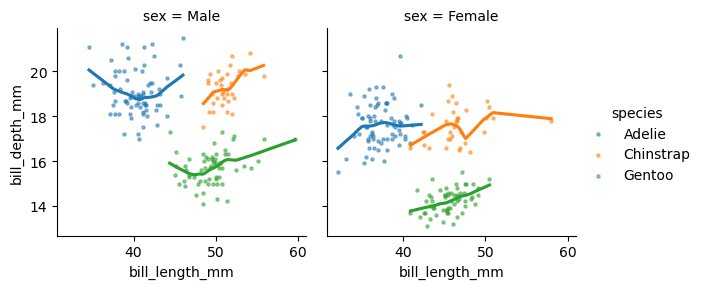
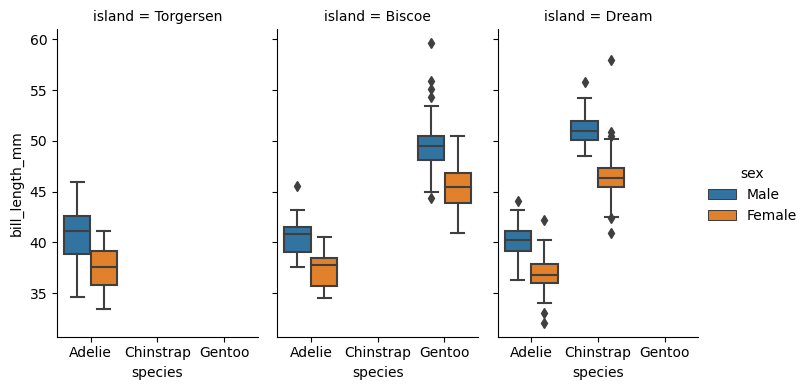
Box plot
penguins = sns.load_dataset("penguins")import plotly.express as px
px.box(penguins.dropna(subset=["sex"]), x="species", y="bill_length_mm", color="island", facet_col="sex")Unable to display output for mime type(s): application/vnd.plotly.v1+jsonpenguins = sns.load_dataset("penguins")
sns.catplot(
data=penguins, x="species", y="bill_length_mm", hue="sex", col="island",
kind="box", height=4, aspect=.6,
)
plt.show()